


Within this article we are going to break down the chance creation statistics of the tournament at large and assess the value of each sides approach play. Given this is a tournament format which progresses into knockout rounds we are going to weight our metrics in Per 90, which naturally levels out the statistics to factor in each teams’ total minutes played.
Overall Chances Created
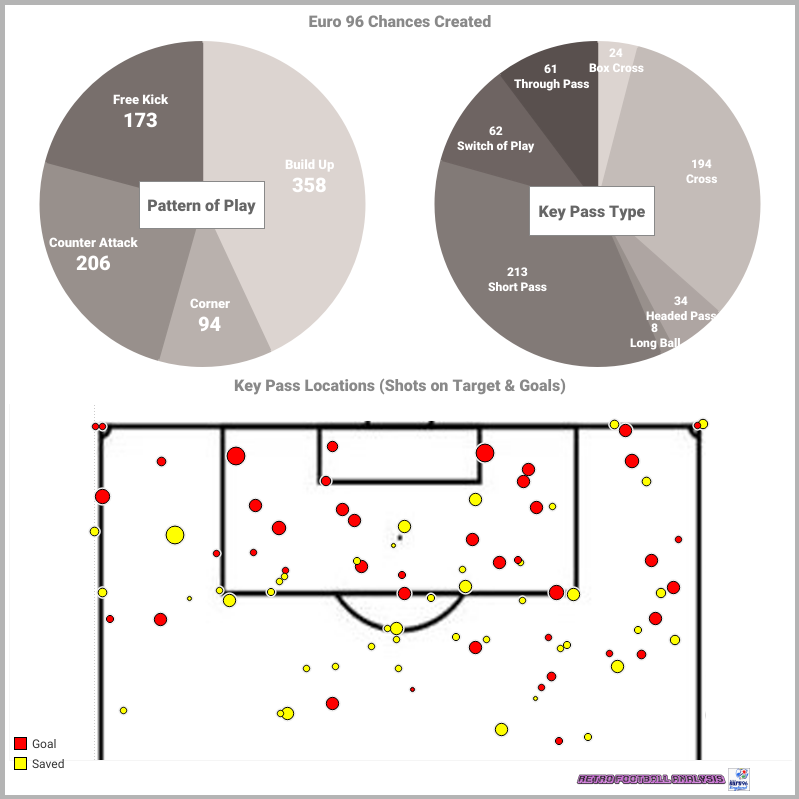
Assessing the tournament at large there is a number of takeaways we can make of the approach play that we saw in the tournament:
- With 358 attacks generated through build up play we see that there was still a bigger emphasis on creating shots through working a chance into the box, however only 31% of these chances resulted in a shot on goal.
- We saw a far bigger return on shots on goal from counter attacks which brought only 206 shots overall, but would return a 40% chance success rate in testing the keeper.
- Set plays still remain an important part of attack play in 1996, with 267 attacks in total coming from dead ball situations. We’d also see a 40% success rate in terms of set play efforts resulting in a shot on goal, with Free Kicks marginally beating out corners (22.54% to 18.09%) for efforts on target.
- When we break down Goals from each Pattern of Play we find some interesting data, especially so in Build up Play. While 31% of all build up play attacks ended in a shot on target, only 5% would finish off in a goal.
- Only 2% of free kicks taken would end in goals, which is also surprising given the quality of players on show at the tournament (Djorkaeff, Zidane, Hagi and Stoichkov to name but a few).
- The most interesting finding was that 12% of all counter attacks would result in a goal, which finished as the most effective way to score a goal at the tournament, with 25 of the 64 goals scored at Euro 96 coming from this Pattern of Play.
Chance Creation Analysis
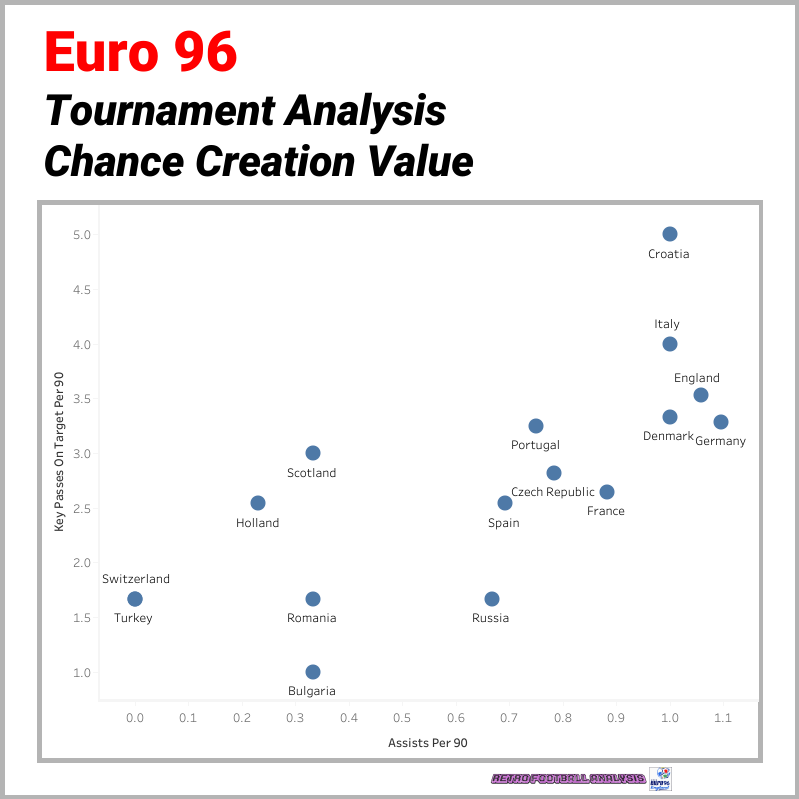
Within this study we first of all consider the amount of goal assists that each team create Per 90 minutes, and then factor in the amount of Key Passes each team creates that result in a shot on target Per 90 minutes. We are essentially looking to grade how frequently a side is creating its own scoring opportunities against how effective their outcome is. Given the technology we had at our disposal we were not able to use expected assists to gauge chance creation, so we have used an output driven model to assess performance.
Best Performer:
In looking at the graph we can see three distinct clusters, with Germany, England, Denmark, Italy and Croatia forming the best performing group of teams. While Germany were marginally out in front with the most assists per 90, the award has to go to Croatia who were marginally below Germany in AP90 but excelled in Key Passes on Target P90 with a score of 5.00, the closest of which was Italy with 4.00.
When we break down Croatia’s attacks created from Open Play we found 44 shots on goal (26 from Build up play and 18 from counters), which in itself is impressive from only 360 minutes of football. Further to this we also found that 20 of these 44 efforts hit the target, which shows they had a conversion rate of 45.45%, the highest at the tournament.
Worst Performer:
While Switzerland and Turkey would finish bottom of the pile, Turkey who didn’t score a goal and Switzerland’s goal coming from a penalty therefore unassisted, we also have to shine a light on Bulgaria who for sure entered this tournament as outside contenders, certainly to advance into the latter stages. With a front line of Penev, Kostadinov and Stoichkov you’d feel there is enough quality there, certainly when they are backed up by a midfield that contains Balakov and Letchkov. With only 16 key passes created across the 270 minutes of football they’d play at Euro 96, it brought about a performance that certainly was below the ability level they possessed, especially as they generated 30 shots on goal overall, which suggests a clear disconnect in how they wanted to build the game versus how they’d try and take their chances.
Individual Chance Creator Analysis
In this final analysis we look at the individuals who would create the most attacks for their respective teams. Much in the same way as assessing team performances, we again use Assists Per 90 and Key Passes per 90.

Given the very slight difference in overall output I am going to give a joint award to Aljosa Asanovic and Youri Djorkaeff.
Asanovic performed a critical role in the Croatia midfield, serving both as a shield for his defensive line, but also as the first line in attack when the back line was building forward. We see in this graphic he was often at the base of the midfield in a 352/3142 system, that was built around getting quality service into the strikers early and forcing the opponent to play on the back foot.

Asanovic’s range of passing was absolutely exquisite, which naturally lends itself to having a very good delivery from deep to cross the ball into dangers attacking areas. The majority of his key passes came from switches of play and crosses (3 each) and overall he’d create two assists in his 3 & 1/2 matches. The best example of the quality in his approach play was best exemplified with the driven pass from right to left for Suker to latch onto and chip the stranded Peter Schmeichel in the Denmark goal in Game 2.
Djorkaeff would top the assists table with 3, but his overall danger wasnt just in a creative capacity for others, his quality in attack also added to his overall potency.
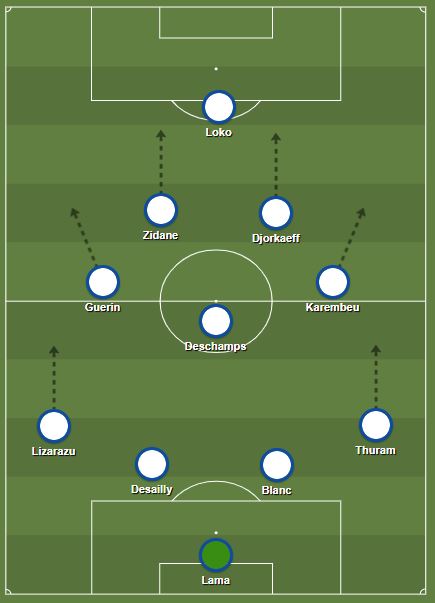
Djorkaeff was positioned in a very attacking central role, one that I think has become more commonly used by Mo Salah and Saido Mane in recent times at Liverpool. He’s ability to link with both Zidane and Loko in tight areas was exceptional, especially given that very rarely did he have any natural width available to him to stretch the play.
Djorkaeff would top the Key Passes table at the tournament, creating 14 attacks overall which is naturally weighted in the chart by his minutes played. From this 14 we’d see 10 crosses, which was brought by an even split of set pieces and open play attacks, such was his quality in dead ball situations he would become a key figure in France’s efforts to progress through the tournament. We also have to add into this that Djorkaeff would create 18 attacks of his own at Euro 96, which would return an xG of 1.35, so to score once and bag three assists, it’s a decent return for someone in a French side that truly was built to soak up pressure and move forward on the counter attack.